Shaping information: transforming data into meaning

Rooted in UX and UI Design principles, our solutions go far beyond visualizing data — they become strategic tools that empower confident, data-driven decisions. With us, your data stops being a collection of numbers and becomes a clear, compelling narrative that turns into meaningful insight.
  • Dashboard Design
  • Data Visualization
  • Data Comic
  • Training & Enablement
  • Design System & Brand Guidelines
  • Digital Products
Business intelligence topics
We turn data into intuitive, engaging tools that people actually enjoy using. By applying cutting-edge UX and design principles, we involve you throughout the process — testing, iterating and refining until we deliver solutions that are clear, impactful and built to last.

Our design approach

Data visualization isn’t just about “looking good” — it’s one of the most powerful ways to communicate and analyse information. With a structured, user-centred process, we transform complex data into visual experiences that are clear, immersive and fully tailored to your needs, helping teams understand faster and make better decisions with confidence.
Dashboard Design

FROM REQUIREMENTS TO TAILORED EXPERIENCES

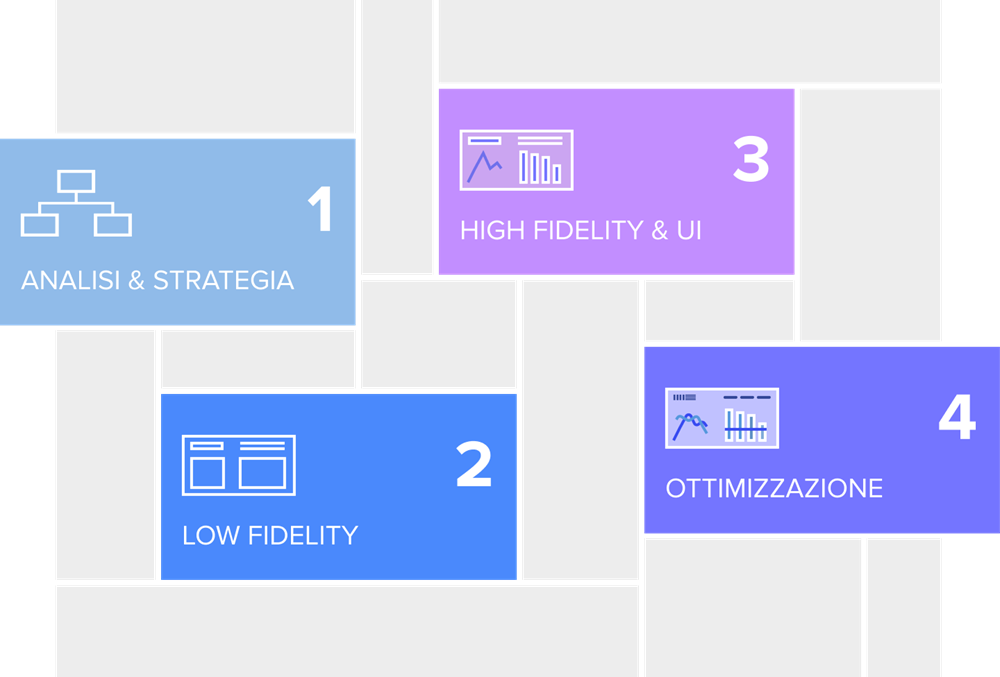
Every dashboard starts with listening to your needs. Every stage of our design process — from low-fidelity concepts to high-fidelity prototypes — is built to test, refine and shape a dashboard that truly fits your business.

UX + UI: the foundation of our approach
Our work blends UX (User Experience) and UI (User Interface) design, two complementary disciplines that guide every design decision:

  • UX Design defines the strategy, structure and content to optimise the user experience from the very beginning.
  • UI Design brings everything to life, shaping the visual language of the dashboard so data and insights are instantly clear and accessible.

A DESIGN THAT REFLECTS YOUR BRAND

 We don’t just build dashboards — we create digital products that seamlessly reflect your brand identity. Each dashboard becomes a unique, interactive experience that communicates your data clearly and guides users towards the insights that matter most.

  • Dashboards as integrated digital products
  • Bespoke design systems tailored to your brand
  • From static visuals to fully interactive dashboards
When data becomes… a story, a dashboard
Every solution we create is the result of a deep dialogue with our clients — understanding their needs, challenges and goals. Explore a selection of our Information Design projects, where we transform data into clear, intuitive and highly functional visual experiences.

Get in touch and discover the best solutions for your business.