How we move every day: an interactive visual story on urban mobility
Urban mobility is one of the most significant phenomena of daily life, yet it rarely receives systematic analysis. In 2025, over 73% of journeys take place in urban areas. Behind every daily commute, different variables are at work — infrastructure, habits, service quality, city planning — that only data can help read with clarity.
We built an interactive visual story on Power BI that explores urban mobility from an unusual angle: your daily habits. The journey is structured as an interactive questionnaire in ten steps. Each answer triggers a visualisation that connects the individual choice to literature data and urban mobility indicators, building a progressive narrative that links personal behaviour, environmental impact and social dynamics.
Navigate the visual story to explore:
- Reasons for travel: why we move — work, study, errands, leisure — and how these motivations are distributed across the urban population.
- Mobility habits: how often we travel, at what times and over what distances, comparing your answers with available data.
- Modes of transport: private car, public transport, bicycle, walking: how different modes are distributed across Italian cities and what drives the choice.
- Active mobility: the role of walking and cycling, with data on health, environmental impact and dedicated infrastructure.
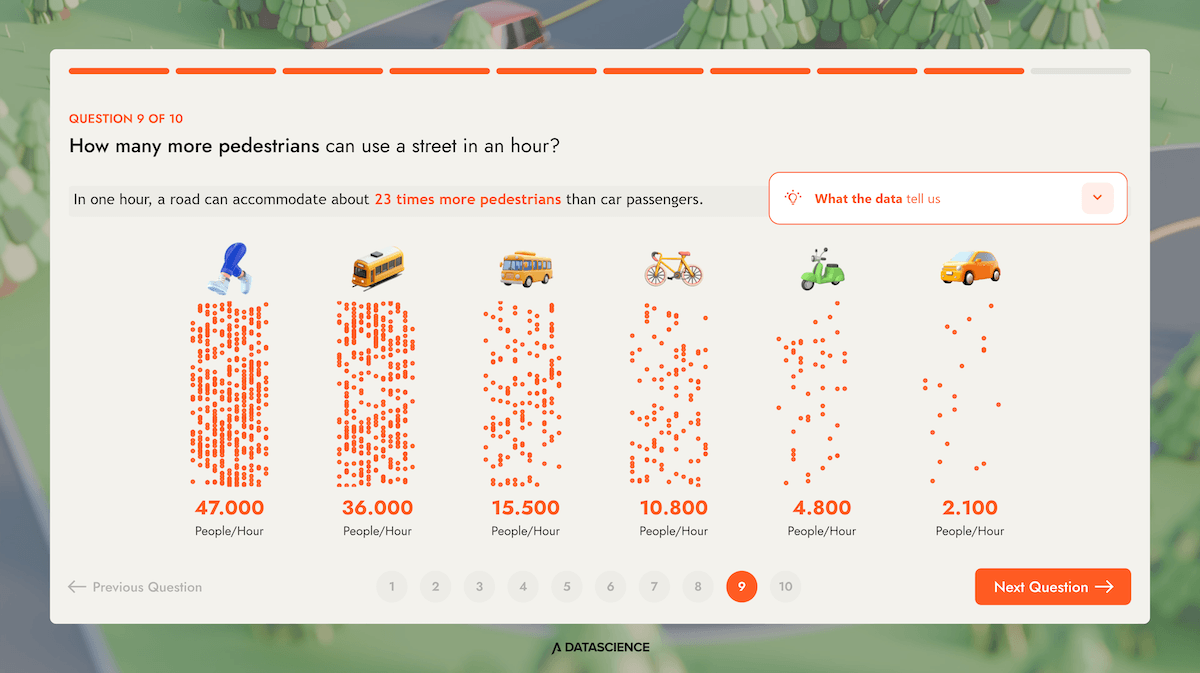
- Urban infrastructure capacity: an analysis of infrastructure provision in Italian cities and its impact on the quality of daily travel.
- Perception of mobility: how citizens rate mobility quality in their city, and where the main pain points are concentrated.
- Transport preferences: what we would choose if we could, and how far real conditions diverge from stated preferences.
- Environmental impact of traffic: emissions, congestion and social costs linked to the dominance of private transport.
- Availability of dedicated infrastructure: cycle lanes, restricted traffic zones, pedestrian areas and local public transport: where we stand and where we need to go.
- Strategies to improve urban mobility: directions indicated by data and urban policies to make travel more efficient, safe and sustainable.
The data that emerges reflects a still-unstable balance: private transport remains dominant, yet interest in more efficient and integrated forms of mobility is growing. Urban policies are increasingly oriented towards public transport, cycling and multimodal integration — but understanding this transition requires clear data and tools to interpret it.
Through Data Visualization and Data Storytelling, a complex phenomenon like urban mobility can be transformed into an accessible reading tool — useful not only for research, but for informing decisions at every level, from public policy to corporate choices in logistics, HR and workspace management.
Explore the visual story: